Products - Charts - Gray Scale/ Tonal response and contrast
IE TE042
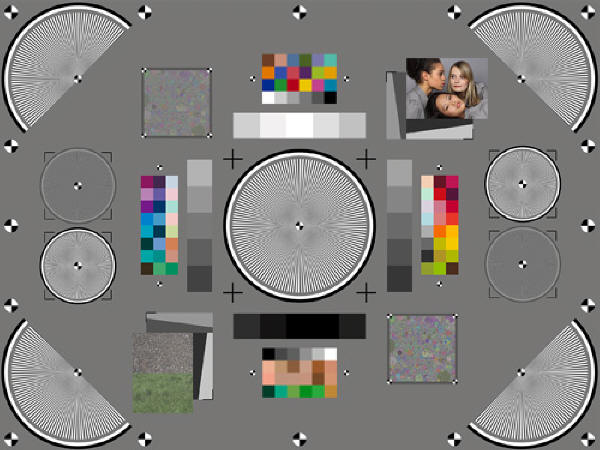
Image Engineering improved the successful multi-functional chart for testing digital cameras and lenses: With one single chart !
Image Engineering improved the
successful multi-functional chart for testing digital cameras and lenses: With one single chart OECF (Opto
Electronic Conversion Function), dynamic range, resolution, texture loss, shading, distortion, lateral
chromatic aberration and color reproduction can be measured according to ISO standards. The chart can
be analyzed with the corresponding software (iQ-Analyzer). For analysis please use the individual reference files delivered with your chart.
The gray scale, arranged around the central Siemens star, is used to determine the opto electronic conversion function (OECF). It describes
how the digital camera transfers luminances into digital values. The patches are analyzed for all three color channels red, green and blue in color images.
There are three significant characteristic values derived from the OECF: SNR (relation between signal and noise), Visual Noise (takes into account that the visual perception of noise can be different for observers compared to a mere SNR approach) and Dynamic Range (contrast in a scene reproduced by the digital camera).
Back
